In this tutorial we investigate how strong wind affects ship motions. We use anlt-wind-solver to simulate wind with constant velocity and direction. Then we run simulation multiple times for wind speed up to 100 m/s and see what happens to the ship under the effect of the hurricane.
First, we load Aurora and create new instance of the testbed. (define ship (make-ship #:hull (import-hull "aurora.bsp"))) ;; import Aurora from the file
(define grid
(make-grid
#:min '(-150 -150 -100)
#:max '(150 150 2)
#:num-points '(256 256 64)))
(define vtb
(make-testbed
#:policy 'openmp
#:grid grid
#:ship ship
#:wave-generator (make-calm-sea-generator) ;; ocean surface with no waves
#:wind-solver (make-anlt-wind-solver #:velocity '(0 100 0)))) ;; our wind solver
Here we use anlt-wind-solver to simulate wind with speed of 100 m/s in positive Y direction and calm-sea-generator to simulate ocean surface without waves. Our wind solver does not model interaction between air and water, so there are no waves in this simulation.
Now lets run the simulation in for 30 seconds with vtestbed-gui(1) and see what happens. (for-each
(lambda (i) (testbed-step! vtb 0.1))
(iota 300))
(set-testbed! vtb) ;; display the result in GUI
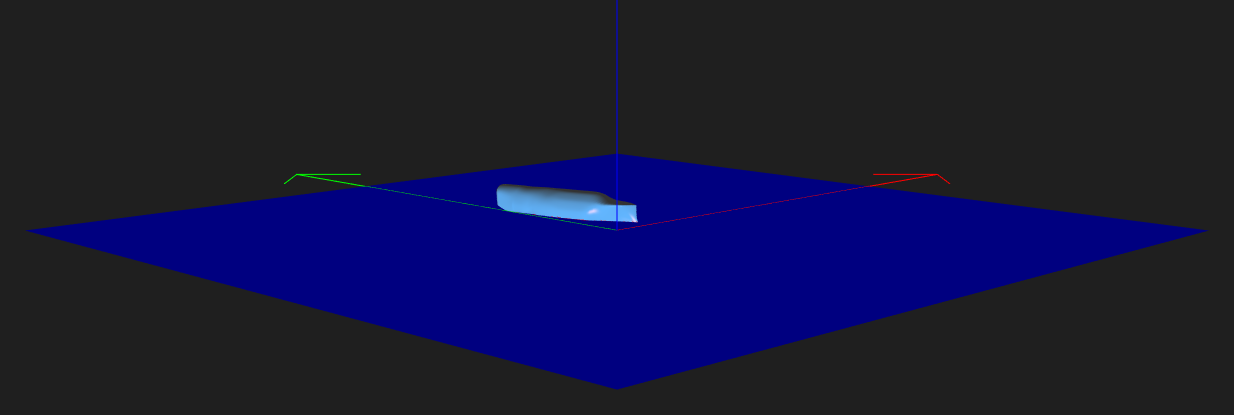
As we can see in the picture below, the ship heeled under the effect of the wind and drifted in the wind direction. 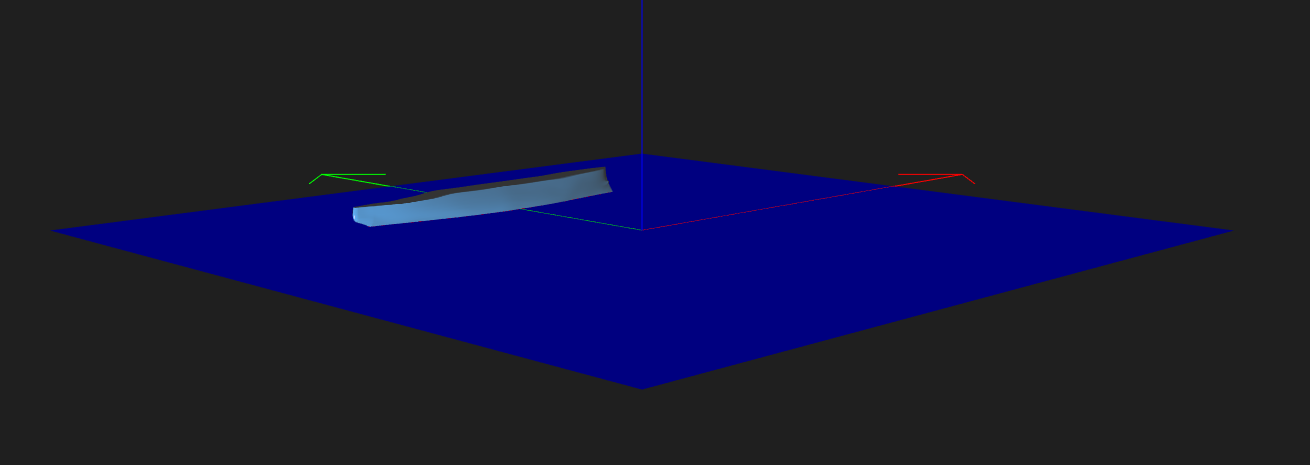
(for-each
  (lambda (i)
    (define v (* 10 i)) ;; wind velocity
    (define vtb
      (make-testbed
        #:policy 'openmp
        #:grid grid
        #:ship ship
        #:wave-generator (make-calm-sea-generator)
        #:wind-solver (make-anlt-wind-solver #:velocity (list 0 v 0))))
    (for-each
      (lambda (i) (testbed-step! vtb 0.1))
      (iota 300))
    (record-statistics v)) ;; extract the data from statistics.log
  (iota 11))
Now lets write record-statistics procedure that parses CSV file and computes maximum roll angle and linear velocity. (use-modules
(srfi srfi-1) ;; reduce
(srfi srfi-4) ;; list-ref list-tail
(ice-9 textual-ports) ;; get-string-all
(ice-9 format)) ;; format
(define (record-statistics wind-velocity)
;; split the file into lines
(define lines (filter (lambda (line) (not (string-null? line)))
(string-split (call-with-input-file "statistics.log" get-string-all) #\newline)))
;; split each line into columns
(define table (map (lambda (line) (string-split line #\,)) lines))
;; get linear velocity column
(define velocity-y (map (lambda (row) (string->number (list-ref row 8))) (list-tail table 1)))
;; get roll angle column
(define roll (map (lambda (row) (string->number (list-ref row 4))) (list-tail table 1)))
;; write maximum values to the end of wind.dat
(define port (open-file "wind.dat" "a"))
;; this procedure computes absolute maximum value for the list
(define (max-abs lst) (reduce max 0 (map (lambda (x) (abs x)) lst)))
(format port "~a ~a ~a\n" wind-velocity (max-abs velocity-y) (max-abs roll))
(close-port port))
Running the resulting script will produce the following wind.dat file. $ column -t s, wind.dat
0 0.00541423 8.63537e-4
10 0.0103156 0.00135422
20 0.0576491 0.00812518
30 0.141342 0.0137788
40 0.265806 0.0236197
50 0.442425 0.0380722
60 0.683953 0.0558232
70 1.0065 0.0766794
80 1.42888 0.0991715
90 1.98644 0.128759
100 2.71798 0.163644
Here the first column is wind speed, the second is linear speed and the third is roll angle in radians. To plot the graph use the following Gnuplot script. set terminal svg size 900,300
set border 1+2
set xtics nomirror out
set ytics nomirror out
set output 'wind.svg'
set multiplot layout 1,2
set xlabel 'Wind speed, m/s'
set ylabel 'Linear speed, m/s'
plot 'wind.dat' using 1:2 with linespoints linestyle 1 notitle
set ylabel 'Roll angle, °'
plot 'wind.dat' using 1:($3/pi*180) with linespoints linestyle 2 notitle